
Rapid Phenotyping
Digital image analysis to assess flower productivity and foliage retention in garden roses throughout the season
- Xu1, Y. Shi2 and D.H. Byrne3a
1Shenyang Agricultural University, Shenyang, China; 2 Biological Systems Engineering, Institute of Agric. and Natural Res, College of Engineering, Univ. Nebraska–Lincoln, Lincoln, NE USA; 3 Horticultural Sciences, Texas A&M University, College Station, TX , USA
Abstract:
A good ornamental garden rose needs to maintain good foliage coverage and abundant flowers throughout the growing season. Unfortunately an evaluator or breeder generally only has the time to assess these characteristics 2 or 3 times during the 6 to 9 month growing season. Consequently much is missed and the best plants may not be identified. Thus a rapid phenotyping procedure which can be done on a weekly basis is needed. Overhead pictures of a series of rose plants were taken on a weekly or monthly basis during the growing season using a Samsung Galaxy Tab4 which was mounted on a selfie stick. At the same time, these plants were assessed for their percent defoliation and flower intensity. Algorithms were developed to estimate the rose canopy cover, density and the percentage of flower cover based on image segmentation and clustering in red-green–blue (RGB) and HSV bands. These algorithms were able to distinguish the flowers irrespective of their color from the leaves. The analysis was capable of calculating the percent of the canopy covered with flowers but not the percent defoliation. This approach, incorporating an unmanned aircraft system (UAS) or ground-based system equipped with cameras and an analytical pipeline, has potential of rapidly acquiring plant development information essential for the proper evaluation of garden roses as well as for field physiology research.
Keywords: plant evaluation, plant breeding, disease resistance, plant architecture, unmanned aerial system, drone
INTRODUCTION
As the genomic technology develops, the ability to generate genomic information about plants has increased tremendously. Unfortunately the ability to phenotype plants has not kept pace and thus is a bottleneck in our ability to phenotype thousands of plants within a breeding program but also to evaluate plants in a range of environments to assess their commercial value, to monitor production fields to optimize their management, and to assess regions for damage caused by various biotic and abiotic stresses. Within the last decade with the improvement of data analysis and storage, it is becoming possible to collect and analyze digital images of plants and fields using a range of sensors including RGB (red-green-blue) cameras, infrared and multispectral cameras and lasers. These images can generate information on shape (2D and 3D), color, height, biomass (volume), canopy temperature, and a range of vegetative indices. Thus beyond describing the physical attributes of the plants various physiological traits related to chlorophyll content and stomatal conductance can be measured (An et al., 2017; Diaz-Garcia et al., 2016; Shi et al., 2016; Tattaris et al., 2016). With the selection of ornamentals, especially perennial ornamentals, it is essential that they maintain a constant leaf cover and a consistent and high percent of the plant covered with flowers throughout the growing season. Typically ornamental evaluators/breeders can only evaluate their plots once a month at most and many only evaluate once every 2-3 months. Unfortunately this is inadequate to accurately evaluate the ability of the plant to maintain its foliage (lost due to both biotic and abiotic stress) and produce a constant supply of flowers throughout the year. Both these traits are changing on a daily basis and therefore need to be monitored on at least a weekly basis for good accuracy. In the breeding program in College Station, three major stresses in our fields are black spot fungal disease that causes spots and defoliation, cercospora fungal disease which primarily causes leaf spotting, and heat stress which affects the general plant growth, flower production and flower size. The challenge is to follow all three of these traits throughout the year. The objective of this work was to determine if we could use overhead digital images to assess the percent of leaf retention (defoliation) and the flower intensity (percent canopy covered by flowers) of roses in the field.
MATERIALS AND METHODS
A large rose trial consisting of over 200 cultivars replicated as three single plant plots was planted in double rows with 5 feet between rows and 4 feet between plants in the fall of 2015 and spring of 2016 in the TAMU Rose Breeding research field. These plants are surrounded by a black weed barrier ground cloth, were watered as needed but no fungicides or insecticides were applied. A set of rose cultivars which varied in plant/flower shape, color and size were selected to be monitored throughout the season. These plants were photographed and monitored throughout the season by Wenji Xu either on a weekly schedule or a monthly schedule beginning on April 22nd and ending on October 28th, 2016. The pictures were taken using a Samsung Tab4 tablet. Initially the overhead pictures were taken by holding the tablet but later we employed a selfie stick to be able to more easily position the tablet directly over the plant. On the same day the plants were visually evaluated for defoliation, flower intensity, and landscape quality. Once we had collected a series of pictures, Yeyin Shi, developed an algorithm to analyze the photos to distinguish between the foliage and flowers and estimate the proportion of each. The greens leaves were distinguished using the green-red channels whereas the flowers irrespective of their color, were separated in the digital image using the hue and value channels. These grey level images were further processed using the Otsu segmentation procedure to convert them into a binary data set. Correlations were done between the image generated estimates of the percent of the canopy covered with flowers and percent green leaves with the ratings done on the plants for flower intensity, and percent defoliation.
RESULTS AND DISCUSSION
Examination of the original RGB digital images (Fig. 1) with the processed pictures separating out the plant from the background and leaves from flowers indicated that the algorithm worked well in a range of light conditions. In one case it could not distinguish between light green chlorotic leaves and white/yellow flowers and thus some improvements need to be made. The ratings of defoliation were not correlated to percent green leaves as calculated from the digital photographs of the plant. This, in part, may be due to using only one view of the plant in the digital analysis whereas an evaluator rating defoliation in the field examines the plant from multiple angles (top and sides) and thus getting a better idea of defoliation. There was an excellent correlation between the percent flower cover as estimated by the image analysis and the ratings done of the plants for flower intensity (Fig. 3). This suggests that this approach would be useful to track the flower development of roses and other ornamentals in breeding nurseries or evaluation trials.
Figure 1. RGB picture with hue segmentation and separation of flowers and green leaves.

Figure 2. Correlation between the percentage of green leaves estimated from digital photographs and ratings of plant defoliation.
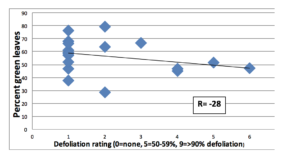
Figure 3. Correlation between the percent of the canopy covered by flowers and field ratings of flower intensity.

CONCLUSION
Such a system would be extremely useful to many ornamental evaluators/breeders if it could be programmed to run automatically and deliver analyzed monitoring data on a weekly basis. Thus the concept would be to develop a photographic drone or ground –based system appropriate to weekly photograph small plots (1-2 acres with up to 2,000 entries).
ACKNOWLEDGEMENTS
This project was supported by Texas A&M AgriLife Research, the Texas Engineering Experiment Station, Texas A&M Center for Geospatial Sciences, Applications and Technology, and the Texas A&M Center for Autonomous Vehicles and Sensor Systems. Field work was supported by the Robert E. Basye Endowment in Rose Genetics, the Chinese Scholarship Council and the USDA’s National Institute of Food and Agriculture (NIFA) Specialty Crop Research Initiative project, “Combating Rose Rosette Disease: Short Term and Long Term Approaches” (2014-51181-22644/SCRI).
Literature cited
An, N, Welch, S.M., Cody Markelz, R.J., Baker, R.L., Palmer, C.M., Ta, J., Maloof, J.N., and Weinig, C. (2017) Quantifying time-series of leaf morphology using 2D and 3D photogrammetry methods for high-throughput plant phenotyping. Computers and Electronics in Agriculture 135, 222-232 http://dx.doi.org/10.1016/j.compag.2017.02.001
Diaz-Garcia, L., Cavarrubias-Pazaran, G., Schlautman, B., and Zalapa, J. (2016) GiNA, an efficient and high-throughput software for horticultural phenotyping. PLoS ONE 11, e0160439 doi:10.1371/journal.pone.0160439
Shi, Y., Thomasson, J.A., Murray, S.C., Pugh, N.A., Rooney, W.L., Shafian S., Rajan, N., Rouze, G., Morgan, C.L.S., Neely, H.L., Rana, A., Bagavathiannan, M.V., Henrickson, J., Bowden, E., Valasek, J., Olsenholler, J., Bishop, M.P., Sheridan, R., Putnam, E.B., Poescu, S., Burks, T., Cope, D., Ibrahim, A.,
McCutchen, B.F., Baltensperger, D.D., Avant, R.V., Vidrine, M., and Yang, C. (2016) Unmanned aerial vehicles for high-throughput phenotyping and agronomic work. PLoS ONE 11(7):e0159781. doi: 10.1371/journal.pone.0159781
Tattaris, M., Reynolds, M.P., and Chapman, S.C. (2016) A direct comparison of remote sensing approaches for high-throughput phenotyping in plant breeding. Frontiers in Plant Science 7, 1131 doi:10.3389/fpls.2016.01131